OpenAI Strategic Finance did not start by showing AI making decisions for the CFO. Instead, it broke apart the work that comes before judgment: collecting signals, organizing data, generating options, building analytical interfaces, completing reconciliations, preparing materials, and then handing the results to people for review and approval.
Introduction
In June 2026, the OpenAI Strategic Finance team used the #12daysofChatCodexStratfin hashtag to share, over a series of consecutive posts, how it uses ChatGPT, Codex, and Codex Sites in finance work. At first glance, readers could easily interpret the series as “OpenAI’s finance team built a collection of impressive dashboards,” or simply as one part of the communications activity that followed OpenAI’s confidential S-1 submission in June. But after reading the full series closely, AI4FIN believes it is a remarkably open, practical account from the finance team working closest to AI. We begin with Days 1–6. These six days revolve around the first question: Which units of work does AI enter first? The answer is neither the CFO’s final judgment nor the Controller’s sign-off responsibility. AI first enters the stretch of work before judgment—the work long supported by Excel, email, manual data movement, and individual experience:
- Collecting signals from large volumes of business records;
- Organizing data from different sources into a single object of analysis;
- Generating options for discussion;
- Turning a one-off analysis into an interface that can be refreshed and reused;
- Reconciling plan, actuals, POs, accruals, and transactions;
- Preparing close materials, checking exceptions, and organizing review.
The six days can be divided into two groups based on where the work is concentrated:
-
Days 1–3 expand Finance’s sensing layer. The marginal return on marketing budgets, leading sales signals in customer communications, and workforce plans and recruiting status were previously scattered across agency data, meeting records, email, CRM, HCM, ATS, and organizational hierarchies. AI’s role is to help Finance see what is happening in the business earlier, instead of waiting for month-end or quarterly results before explaining it.
-
Days 4–6 begin to change the finance deliverables themselves. Opex analysis is no longer merely an Excel file maintained by one person; BvA is no longer just a total variance and commentary; and the monthly close deck is no longer merely a PowerPoint whose filename keeps changing in a folder. Interfaces, reconciliation packages, and decks begin to carry states for inputs, refreshes, exceptions, review, and publication. AI is not only generating content; it is also beginning to orchestrate workflows.
The six cases are examined day by day below. Each case answers only six questions: What was the original business bottleneck? What are the inputs? What does AI do? What responsibilities remain with people? What asset ultimately remains? And what is the recommended starting scope?
Why AI Enters These Units of Work First
AI can generate many parts of finance work, but not every task should be handed to AI first. The scenarios chosen for Days 1–6 share several characteristics.
First, they contain large volumes of inputs that are already digitized but not organized. Marketing spend, Gong transcripts, HCM, ATS, GL, POs, accruals, and slide templates already existed in company systems. The team’s problem was not an absence of data; it was the need for someone to find, copy, map, and interpret it every time. AI can most readily enter at precisely this break in the chain—where the information exists but the work still depends on manual handling.
Second, they produce observable intermediate work products. Response curves, account stages, position bridges, Opex pages, reconciliation queues, and slide drafts can all be inspected by people. AI does not need to issue an irreversible final decision. It can first deliver an option, a workspace, or a first draft. Reviewers can see the process and revise the result.
Third, they have clear recurring cycles. Marketing allocation is updated weekly, sales signals are reviewed weekly, the HC view refreshes daily or weekly, and Opex, BvA, and the close deck run monthly. The more frequently a process repeats, the more worthwhile it becomes to turn an individual’s one-off procedure into a reusable unit of work. Every correction the team makes to a rule, mapping, or template remains available in the next cycle.
Fourth, they have natural points of human accountability. Budgets require owner approval, sales stages require business judgment, HC definitions require confirmation from Finance and HR, FP&A owns the metrics in the Opex interface, accruals require accounting judgment, and the close deck requires owner review. AI can enter the preparation work without redistributing final responsibility at the outset.
Finance teams can use a simple screening table to find their own first use cases:
| Screening question | Characteristics suited to an early trial |
|---|---|
| Where are the inputs? | They already exist in a small number of systems or fixed files |
| Does the work recur? | Similar steps are used weekly, monthly, or quarterly |
| Can the intermediate result be reviewed? | There is a table, classification, option, interface, or draft |
| Can exceptions be handed to a person? | Uncertain items can enter a clearly defined queue |
| Who owns the outcome? | A reviewer, owner, or approver already exists |
| Is failure reversible? | The first version is read-only and does not directly change the books, modify a budget, or publish |
If a scenario requires AI to find unknown data, define new policies, exercise material judgment, and take irreversible action all at once, it is usually a poor first use case. By contrast, tasks with relatively clear inputs, long manual preparation time, and outputs that already require review can often produce a usable method more quickly.
Group One: Days 1–3, Expanding Finance’s Sensing Layer
Day 1 | Marketing Spend: From Performance Reporting to Budget Allocation Options
Business Problem
Marketing Finance often has an abundance of historical reporting, yet still struggles to answer a more valuable question while the budget can be changed: Where should the next dollar go?
Traditional reporting can tell the team how much a channel spent, its average ROAS, and how much of its target it achieved. But average performance conceals marginal change. A channel may look strong overall even though incremental budget has already pushed it into saturation; another market may be smaller today but still offer a higher marginal return. The real operating action is not to re-rank channels. It is to propose executable donor→receiver shifts within constraints on budget, contracts, brand, and market capacity.
This also changes Finance’s position in marketing decisions. In the past, Marketing Finance often explained variances after the period ended. If it can continuously observe response curves, Finance can participate in resource-allocation discussions earlier.
Inputs and Context
The input to this unit of work is not a summarized channel table. It is spend and outcome data broken down by date, market, channel, and campaign or keyword. An official OpenAI presentation explained that the team obtained data by dimensions such as geography, channel, and keyword from marketing agencies, then used Codex to build an ROI dashboard.
For the analysis to support decisions, several types of business context must also be added: the currently approved budget, non-transferable budget, channel floors and ceilings, contractual commitments, market capacity, and the formal definition of the outcome. If the company already has experimental or MMM results, the response curve should be paired with incremental estimates instead of relying on correlational fit alone.
AI’s Role
AI performs three layers of work here.
The first is analysis. It compares spend and outcome across market-channel combinations, fits response curves, and identifies declining marginal returns and saturation ranges.
The second is building. It turns filters, scatter plots, fitted curves, and a budget recommendation table into an interactive interface. Finance and Marketing can switch among markets, channels, time ranges, and spend caps without rewriting the analytical scripts each time.
The third is proposing options. The system does more than show historical performance: it generates a donor market-channel, receiver market-channel, proposed shift, and estimated uplift, helping the team move the analysis into a budget discussion.
The organizational significance is that analysts no longer spend most of their time rerunning charts and assembling a recommendation deck. AI generates a constrained set of options first; Finance focuses its effort on model assumptions, executability, and capital tradeoffs.
The Human Role
People still decide what “better” means.
A model can fit or estimate marginal returns, but a response curve based on observational data is not inherently the same as a true incremental return. Nor can a model independently judge brand exposure, the strategic value of a channel, contractual restrictions, or the market team’s ability to execute. Marketing Finance must challenge the attribution logic in the data, the growth owner must confirm that a channel can absorb additional budget, and the budget owner decides whether to approve the shift.
Another human responsibility is distinguishing estimated uplift from realized uplift. After an option is executed, the team must feed actual spend, actual outcomes, and reasons for deviations back into the next round of analysis. Otherwise, AI can generate new recommendations every week without any mechanism for determining whether they actually worked.
Reusable Asset
The most valuable asset from Day 1 is not a static ROI dashboard. It is a repeatable marketing allocation model:
- Fixed data inputs and metric definitions;
- Refreshable response curves;
- Constrained budget allocation options;
- A decision record covering proposed, approved, executed, and measured;
- A retrospective comparison of predicted uplift with actual results.
This asset can support a weekly budget meeting and also become an input to quarterly budgeting and scenario analysis. The interface is only the entry point; the model, constraints, and decision history are what get reused.
Recommended Starting Scope
Do not begin with global, all-channel optimization. Choose one market, two channels between which budget can be shifted, and one clearly defined outcome. Then select a historical window with sufficient spend variation. A pilot can begin with eight to twelve weeks, but whether that window is sufficient still depends on data granularity, spend variation, seasonality, and sample size; the model must not automatically extrapolate beyond the training range on that basis.
The first version should answer only four questions: Where does current spend sit on the curve? Roughly what is the marginal return on additional budget? Which constraints prevent budget from moving? And how will the team review the results after the recommendation is implemented? It should not modify the budget automatically, nor does it need sophisticated global optimization. If a budget review can move from “looking at average ROAS” to “discussing marginal return, constraints, and actual results,” the team has already created a useful change in how the work gets done.
Scope of public evidence: The image in the main post and the official presentation directly show the response curve, saturation, and donor→receiver recommendation table. The specific model selection, budget approval, and actual uplift are drawn primarily from the team’s description; the full implementation was not made public.
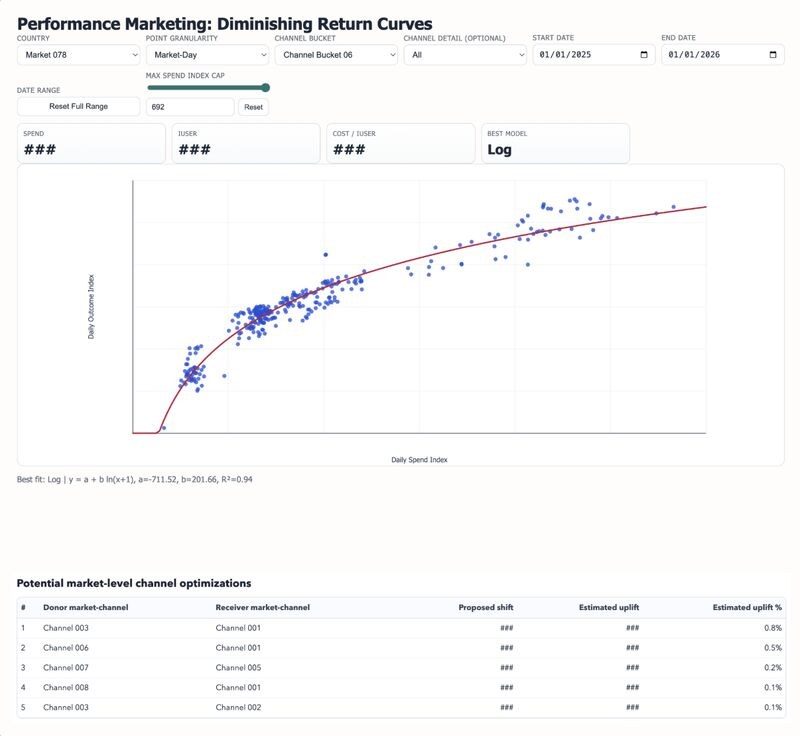
Caption: Day 1 advances marketing reporting into candidate budget allocation. The interface is not the final decision-maker; it lets the team discuss marginal returns and constraints.
Day 2 | Sales Field Signals: Turning Customer Communications into Leading Sales Indicators
Business Problem
After a new product launches, quarterly revenue is too late an indicator. The CFO and CRO want to know sooner: Has Sales actually brought the product into customer conversations? Are customers at introduction, technical evaluation, pilot, or rollout? Which segments and geographies are accelerating? Which accounts need additional support?
The traditional approach is to add fields to CRM and require salespeople to complete them every day. The problem is not that the fields cannot be built; it is that frequent reporting is difficult to sustain, while the detail in the original conversation gets compressed into a crude label. A much richer set of signals already exists in Gong transcripts, customer email, Slack, pipeline, and product usage. It simply has not been organized into an operating view that Finance can use.
Inputs and Context
The context used on Day 2 includes customer-sales communications, account context, CRM pipeline, and product usage. The official presentation explicitly mentions Gong transcripts and customer emails; the original post also mentions Slack, pipeline, and product usage.
These inputs cannot simply be combined into a single score. Each record must first be mapped to the authoritative account ID, then deduplicated and aggregated by account, product, and period. The company must also define a stage taxonomy in advance: What counts as introduction? What evidence is required to enter technical evaluation? Where is the boundary between pilot and rollout? And how are blocked and no evidence distinguished?
AI’s Role
AI first acts as a layer for information extraction and classification. It identifies product-related passages in calls and emails, preserves the speaker, time, and original language, and then assigns the signals to the defined stages.
It then aggregates account-level signals into segments, geographies, and weekly trends, allowing Finance to observe launch momentum before revenue outcomes appear. AI can also display CRM stage, communication signals, and product usage side by side, flagging accounts where the signals reinforce or conflict with one another.
This role differs from “predicting win probability.” It does not need to assign every account a black-box score from the outset. A more useful first step is to organize evidence once scattered across hundreds of conversations into a review queue, so Finance, RevOps, and sales leaders know which accounts warrant attention and why.
The Human Role
People define the signals, and people interpret them.
Sales and RevOps must jointly set the stage rules, review low-confidence classifications, and correct identity-mapping and contextual errors. Finance uses the signals to support resource allocation, but it cannot interpret “no visible communication” as a stalled customer by default: the relevant discussion may have happened offline or outside the systems to which it has access.
People must also decide what the data may be used for. Using customer communications for a launch review and specialist resource planning is an entirely different organizational policy from using them directly to score individual sales performance. The latter changes employee behavior and raises privacy and trust issues; a model cannot make that choice by default.
Reusable Asset
Day 2 can ultimately produce three types of assets:
- A sales-stage taxonomy and a set of human-labeled examples;
- A signal model that maps Gong, email, CRM, and usage to an account;
- A launch-review workspace containing source-text evidence, confidence, and the reviewer’s decision.
As human corrections accumulate, these assets gradually form the company’s own launch knowledge: what kinds of customer language usually indicate evaluation, which technical issues frequently block a pilot, and which segments need specialist support. This is not just a one-off dashboard; it is a classification and review mechanism that can continue to learn.
Recommended Starting Scope
Choose only one product, one segment, and two approved source types—for example, Gong transcripts and CRM account context. Begin with a sample of twenty to fifty accounts to establish the taxonomy and initial labeled set, then reserve an independent sample for evaluating false positives, false negatives, and reviewer disagreement.
The first version should produce a weekly output containing account, stage, evidence span, confidence, conflict, and reviewer decision. Do not modify pipeline automatically, connect all employee email, or score individual performance. First determine whether the queue helps Finance identify launch problems earlier, and whether reviewer corrections reliably improve the next round of classification.
Scope of public evidence: The main-post image directly shows a synthetic/anonymized weekly dashboard. The Gong, email, and Slack inputs, account drill-down, and stage-classification process come primarily from the post and the official presentation.
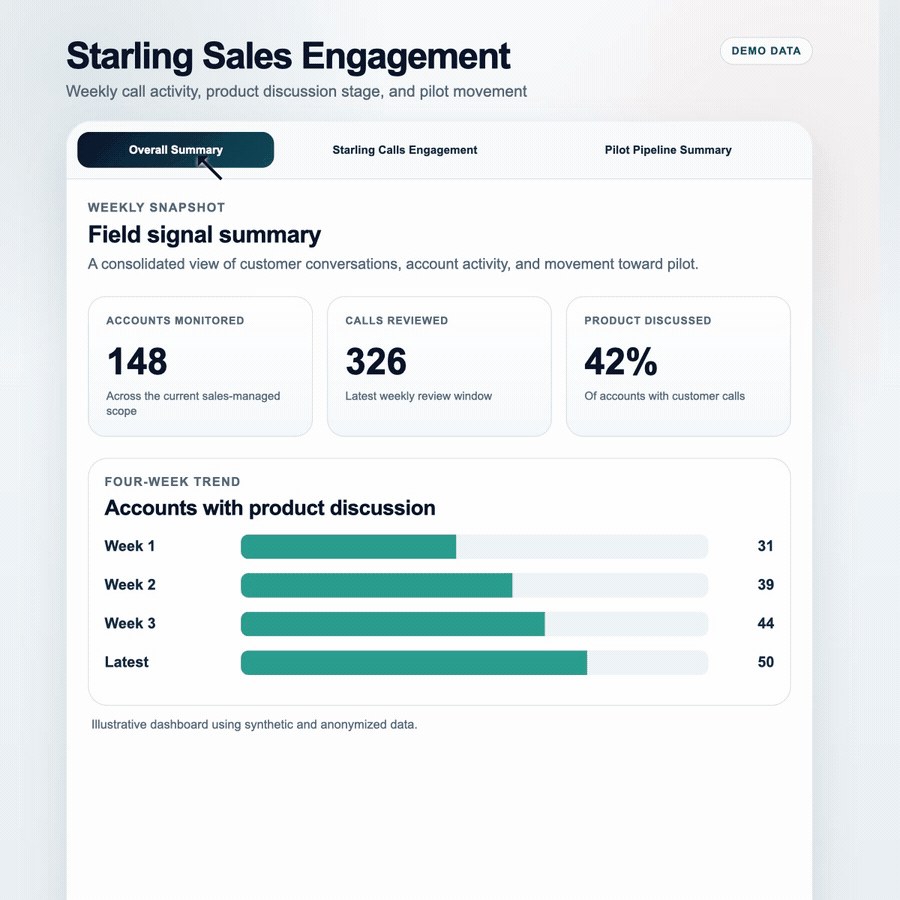
Caption: Day 2 does not add more CRM reporting. It organizes existing customer communications into leading indicators that can be reviewed.
Day 3 | Headcount Visibility: Turning Workforce Status into an Operating-Capacity View
Business Problem
The hardest part of headcount reporting is not counting employees. It is understanding the complete capacity pipeline of “already in seat, offer accepted, actively recruiting, and approved but not yet released” at the same time.
These states are distributed across the position plan, HCM, ATS, and organizational hierarchy. The planning system knows whether a position has been approved, ATS knows the recruiting status, HCM knows whether an employee has started, and the manager hierarchy determines which leader, region, or segment owns the position. Each system sees only part of the picture.
For a Finance team supporting GTM, the operating question is not “How many people does the company have?” It is where sales and technical-success capacity is increasing, which approved positions have not been released, which accepted hires have not yet become filled, and whether current HC investment still aligns with strategic priorities.
Inputs and Context
Day 3 uses HCM, planning, ATS, and the manager hierarchy as inputs. To combine these sources into an operating view, the key object is not the employee’s name but the position itself. A unified position ID should be the preferred join key. If the systems do not share an ID, the company must build a stable, versioned position crosswalk instead of relying on fuzzy matching of names and job titles. The position plan, requisition, and employee record must ultimately resolve to the same position object.
Time must also be part of the input. Organizational hierarchy and employee status both change by effective date. A weekly report needs a fixed as-of timestamp and must record the extract time for every system; otherwise, the same dashboard may mix data from different points in time.
AI’s Role
AI first organizes the data across systems: it checks the correspondence between positions and requisitions, aggregates by leader, region, segment, and job family, and classifies positions as Filled, Accepted, Open, or Approved.
It then generates a dashboard, an editable table, and an executive summary. Finance no longer has to copy numbers from different systems each week, rebuild pivots, check the organizational hierarchy, and then rewrite the result as a leadership update. The system can compare the current and prior-week snapshots, flagging additions, cancellations, delayed starts, manager changes, and approved-but-unreleased roles.
If it is connected to collaboration tools, AI can also draft an update suitable for management. But the most important change is not “automatically posting to Slack.” It is that the dashboard, table, and summary are all generated from the same position-level view. The analytical interface and management narrative no longer maintain separate sets of numbers.
The Human Role
People define position statuses and handle exceptions.
When an accepted candidate becomes filled, whether a frozen role still counts toward capacity, how to treat a canceled requisition, and which effective date applies to an organizational change all require joint confirmation from Finance, HR, and Recruiting. The model must not silently merge duplicate positions or guess a manager mapping just to make the totals reconcile.
Finance also decides what information may enter leadership interfaces and collaboration channels. Most operating discussions do not require a candidate’s name, compensation, or interview feedback. People approve the summary and also limit the output fields, channel scope, and refresh cadence.
Reusable Asset
Day 3’s most reusable asset is a position-level operating model:
- A unified position object across the position plan, HCM, and ATS;
- Mutually exclusive definitions of Filled, Accepted, Open, and Approved;
- An effective-dated hierarchy;
- A Plan → Approved → Open → Accepted → Filled bridge;
- Weekly changes and an exception queue;
- A dashboard, Google Sheet, and management summary generated from the same data view.
This asset can later feed the HC forecast, capacity planning, recruiting priorities, and Opex analysis. Its value is not merely turning a monthly update into a weekly one; it converts HC from a static headcount table into an explainable operating-capacity pipeline.
Recommended Starting Scope
Choose one organizational branch under a single leader and freeze position-plan, HCM, and ATS snapshots as of the same date. The first version should prioritize reconciliation on a unified position ID. If no common ID exists, build a versioned position crosswalk first, then generate the Approved → Open → Accepted → Filled bridge and separately list missing positions, duplicate requisitions, frozen roles, and failed manager mappings.
Have Finance, HR, and Recruiting agree on the same exception queue before generating a leadership summary. Do not post it automatically to Slack yet. Once the weekly process no longer depends on one person manually explaining why three systems do not agree, this unit of work already has reusable value.
Scope of public evidence: The main-post image directly shows HC statuses, leader/subteam rollups, and an entry point to the summary. HCM/ATS connections, hierarchy checks, and publication to Google Sheets and Slack come from the author’s description.
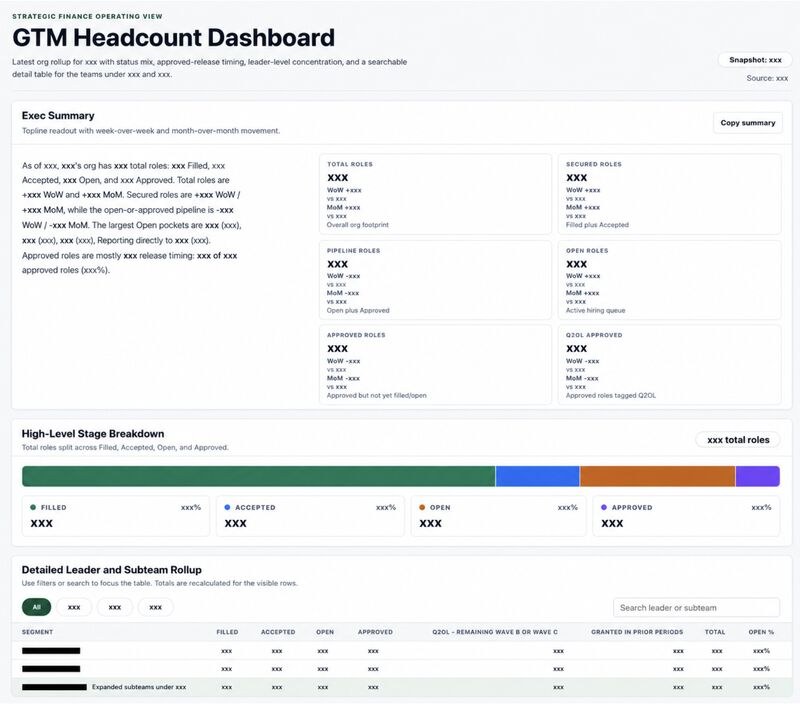
Caption: Day 3 organizes the position plan, recruiting progress, and active-employee status into a single capacity pipeline.
Group Two: Days 4–6, Turning Finance Deliverables into Stateful Workflows
Day 4 | Monthly Opex Web Dashboard: Finance Starts Building Its Own Analytical Products
Business Problem
Many Finance teams do not lack Opex analysis; they lack a delivery format that people can keep using. Each month, analysts pull data from the planning model and ledger, update Excel, take screenshots, copy them into PowerPoint, and explain the same questions to different business owners. Building an interactive interface means waiting for BI or engineering capacity.
According to the author’s description, the change proposed on Day 4 is that Finance users can describe the audience, decision, metrics, tables, commentary, and visuals directly, then have Codex build the web dashboard. Vibe coding here is not intended to turn Finance into a frontend engineering team. Its purpose is to shorten the distance from business problem to analytical prototype to user feedback.
Inputs and Context
A Monthly Opex interface needs period, scenario, entity, cost center, account, currency, Actual, Forecast or Budget, an HC snapshot, a variance threshold, a commentary owner, and formal metric definitions.
The most important issue among these inputs is not the number of fields, but the division of responsibility between the existing finance model and the interface. P&L, A/F variance, FX, and HC calculations should come from governed data or a metric layer; the web interface should handle presentation and interaction. Otherwise, Finance may escape the BI queue only to create a second set of finance logic scattered through JavaScript.
AI’s Role
On Day 4, AI first plays the role of builder. It asks who will use the interface and which decisions it should support, then generates HTML, CSS, and JavaScript to quickly build a page containing P&L highlights, A/F, variance callouts, trends, headcount, and data notes.
More importantly, it can turn a one-off interface into a repeatably refreshable analytical product. AI can read a new approved dataset, update the page, run basic checks, generate a staging version, and adjust the layout and interactions in response to user feedback.
This changes the division of work between Finance and technical teams. Finance can handle the business prototype, field definitions, and user iterations directly. Data/IT can focus on the authoritative data layer, identity and access, the deployment environment, and shared components instead of modifying charts for every cost center.
The Human Role
Finance still owns metric definitions and interpretation. The business partner decides what decision the interface must support, FP&A confirms the definitions of Actual, Forecast, variance, and HC, and the page owner reviews the numbers and commentary.
The Data/IT role does not disappear. It shifts from “building every interface for Finance” to providing a stable foundation: governed datasets, access controls, deployment templates, tests, and monitoring. In a mature collaboration model, Finance can iterate on the presentation layer itself but cannot create new finance definitions at will in a production interface.
Reusable Asset
Day 4 ultimately produces a Finance-owned analytical app template:
- A page structure designed for a specific audience and decision;
- An input contract connected to a governed Opex dataset;
- Reusable components for P&L, A/F, trends, HC, and notes;
- An operating process for refresh, validation, staging, and publication;
- Interface-design rules formed from business-user feedback.
This type of template can be reused across cost centers or business lines. The real speed gain does not come from vibe coding everything again each time; it comes from retaining data interfaces, components, and deployment methods the company has already approved.
Recommended Starting Scope
Choose one cost center, one closed month, and one A/F bridge. Have the existing finance model generate a read-only dataset first. Codex should be responsible only for the interface, not for recalculating finance metrics in the browser.
Deploy the first version to staging and display the data version, as-of time, scenario, and source. Have one Finance business partner use it in practice and observe whether the user can find variances, trends, and commentary more quickly, rather than pursuing a company-wide portal first. This scope is sufficient to test whether Finance self-service building actually shortens iteration time and to clarify which shared capabilities Data/IT must provide.
Scope of public evidence: The main-post image directly shows only the project name and a blank prompt. The final interface and the refresh, validation, and internal republication process come from the author’s description.
Caption: The focus of Day 4 is not a finished interface. It is Finance beginning to participate directly in building the analytical product.
Day 5 | Marketing BvA: Turning Reconciliation from a Back-Office Step into a Workspace
Business Problem
Budget-versus-actual analysis is often reduced to a variance table, but the work that consumes a Finance team’s time usually comes before that table: pulling data from the plan, GL, PO schedule, accrual register, and transaction detail; updating spreadsheet tabs, formulas, and pivots; checking mappings; handling late postings; and then confirming that every layer ties out.
When these steps exist only in an analyst’s Excel workbook and personal experience, it becomes difficult at month-end to tell whether a variance comes from a real business change, a timing mismatch, a missing accrual, or a simple data-processing error.
The Day 5 method puts reconciliation itself into the workspace. The interface displays not only Budget, Posted Actuals, Accruals, and Variance, but also sources tied, unmatched, source status, and largest drivers. Reconciliation is no longer invisible preparation performed before the analysis is generated; it becomes part of the analytical product.
Inputs and Context
This unit of work needs at least four input types: Approved plan, GL actuals, PO schedule, and accrual register. Transaction detail, the mapping table, FX rates, materiality, and control totals provide the necessary context.
The public interface presents Approved plan, posted actuals, and PO-backed accruals as three source types. In AI4FIN’s enterprise reconstruction, the PO schedule and accrual register are separated into two input types to control invoice-and-accrual double counting independently, creating a four-source reconciliation.
Each source type has its own business timing. PO commitment, goods receipt, service receipt, invoice, posting, payment, and accrual period are not the same concept. Only by identifying these states correctly can the system avoid double counting a posted invoice and an accrual that has not yet been reversed, and explain committed-but-not-accrued items and prior-period catch-up.
AI’s Role
AI first ingests and standardizes the different sources, checks fields, periods, currencies, and mappings, then reconciles each source separately to its control totals. Unmapped accounts, missing POs, unusual accruals, and late postings enter an exception queue.
Only after reconciliation does AI generate Budget, Posted, Accrual, Total, and Variance by cost center × category, ranking the principal drivers by impact. Users can drill from a category into a PO, transaction, or accrual record to see what makes up the variance.
AI can also draft commentary, but its starting point is not a total-variance table. It begins with organized drivers and source records. In this way, the data structure supports “what happened,” while Finance and the business owner add the business context for “why it happened.”
This changes task allocation during the close. Analysts no longer spend hours mechanically copying data before rushing to explain variances near the deadline. The system continuously prepares reconciliations and exceptions, while people prioritize high-impact items and matters requiring judgment.
The Human Role
Finance determines the official plan version, mappings, materiality, and accrual treatment. The model can flag exceptions; it cannot create journals, modify accruals, or treat a working forecast as the approved plan on its own.
People are also responsible for the business meaning behind exceptions. The same unmatched PO could reflect a procurement-process problem or a delayed supplier invoice; the same variance could arise from timing or represent a permanent change in run rate. AI can organize the evidence, but it cannot replace accounting judgment and business interpretation.
Reusable Asset
Day 5’s core asset is a reconciliation workspace:
- A unified input contract for plan, GL, POs, and accruals;
- Control totals for each source;
- Mappings and an exception queue;
- An accrual roll-forward;
- Lineage from cost center/category to source record;
- Variance drivers and reviewer commentary.
This asset supports the close and can also feed forecast refreshes, vendor reviews, and spend governance. Reconciliation logic previously used only once at month-end can become a continuously updated finance unit of work.
Recommended Starting Scope
Of the six cases, Day 5 is one of the most suitable starting points for a Finance team.
Choose one marketing cost center and one month, then prepare the Approved plan, GL actuals, PO schedule, and accrual register. The first version should do only four things: produce a four-source control-total table, create an unmatched queue, build an accrual roll-forward, and provide lineage from category to transaction.
Do not pursue a sophisticated dashboard yet, and do not write complete commentary automatically. First test whether each refresh produces a consistent reconciliation and whether it identifies duplicate invoices, unreversed accruals, incorrect mappings, and plan-version changes. If the workspace can turn “whose numbers do not tie at month-end?” into a clearly assignable set of exceptions, it has already changed how the close is organized.
Scope of public evidence: The main-post interface directly shows Approved plan, posted actuals, PO-backed accruals, sources tied, unmatched, and variance drivers. The full four-source process, drill-down, and adjustment workflow come from the author’s description.
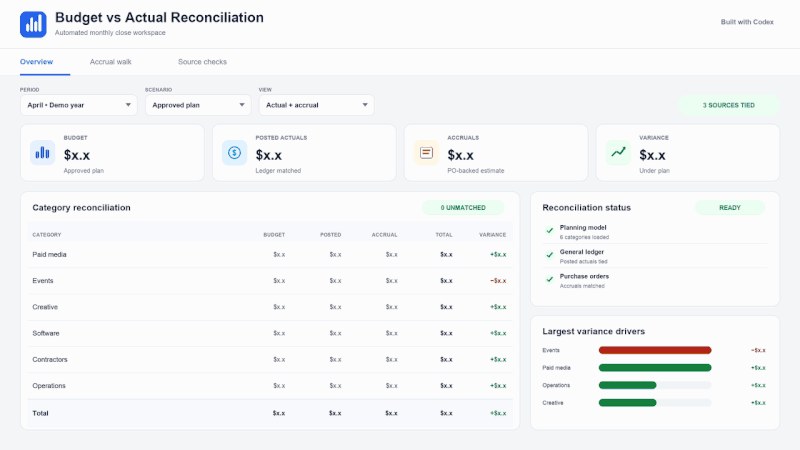
Caption: Day 5 turns reconciliation from hidden preparation before analysis into a workspace that every participant can see and act on.
Day 6 | Governed Monthly Close Deck: Turning File Delivery into a Review Workflow
Business Problem
The problem with a monthly close deck is rarely “not knowing how to make a PowerPoint.” It is that numbers, pages, and narrative keep drifting across multiple tools. Source checks live in Excel, dashboards in the browser, slide updates in PowerPoint, and review comments across email or chat tools. The numbers may have refreshed while the chart is still an old version; after a slide owner revises the commentary, other participants may not know whether the original review is still valid.
The Day 6 method changes the close deck from a final file into a stateful workflow. Inputs, refresh, QA, readiness gaps, slide-owner review, finalizer, and export are no longer just team habits. They become states the interface can recognize and advance.
Inputs and Context
This unit of work requires approved data inputs, review rules, a slide template, business context, period/scenario definitions, and slide ownership. Each slide must also know which source totals, charts, commentary, and evidence it cites.
Period status is especially important. Open period, forecast/outlook, and closed actual cannot use the same narrative. The system must do more than refresh the numbers; it needs to know which sentences are permissible under the current period state and which content must remain framed as outlook.
AI’s Role
AI first organizes the approved inputs, runs the monthly refresh, updates governed tables and slides, and drafts a first-pass narrative from the data and approved business context.
It then checks two types of issues. The first is data logic: Are control totals, formulas, periods, and scenarios consistent? The second is rendered output: Do the labels, units, legends, titles, and commentary on the slide agree with the underlying data? AI can also flag readiness gaps and assign incomplete items to the corresponding slide owner.
During review, the system retains the status, owner, and revision history of each slide. When any number, chart, title, or commentary changes, the corresponding slide should automatically return to awaiting review; final export can be based only on the currently approved version. Q&A can also be constrained to the current dashboard evidence, allowing reviewers to ask about cost changes, GPU mix, or whether the material is ready to finalize, rather than receiving generalized answers detached from the sources.
This case most clearly demonstrates AI’s shift from “generating content” to “orchestrating delivery.” Generating the first slide draft is only one step. What is actually being redesigned is the entire path from refresh to review to export.
The Human Role
Finance checks the numbers, challenges the narrative, and decides whether the materials are ready to share. Each slide owner is accountable for their page, and the finalizer decides whether export is allowed. AI can prompt, draft, and organize; it cannot sign off for a person.
The human role therefore moves from manual data transfer and version tracking to resolving readiness gaps, revising business explanations, and assuming explicit accountability. In the past, a review might appear as “looks good” in a chat. In a stateful workflow, an approval must correspond to a specific slide and a specific version.
This also creates an organizational change: monthly close materials are no longer maintained centrally by “the person who knows the entire file best.” Every slide can have a clear owner, the system aggregates the statuses, and the finalizer handles only versions whose prerequisite reviews are complete. Knowledge no longer depends entirely on a single PowerPoint owner.
Reusable Asset
Day 6 ultimately produces a close workflow, not just a deck template:
- Approved inputs and review rules;
- Refreshable slide components;
- Data QA and rendered-slide QA;
- Readiness status, owner, and comments for each page;
- Source-constrained narrative and Q&A;
- Workflow states for review, finalize, and export.
This asset can be reused month after month and gradually extended to management reporting, board materials, and operating reviews. Each month adds not only a final PDF, but also a record of issues, revisions, explanations, and reviews.
Recommended Starting Scope
Day 6 is another suitable starting point, but the first version should cover only three slides.
Choose three close slides with stable data sources that recur every month, and fix the input dataset, template, owner, and review checklist. AI refreshes the numbers, generates first-draft commentary, runs data and rendering checks, and then routes each of the three slides to its owner for review. Once all three slides pass review, a different finalizer exports them.
The first version is not intended to save the production time for the entire deck. It should test three things: whether the same input consistently generates the same structure, whether unresolved exceptions prevent an item from entering final review, and whether reviewers can clearly see what must be rechecked after a change. If those three slides no longer rely on filenames and group chat to track status, the workflow has already begun to change.
Scope of public evidence: The five frames in the synthetic GIF directly show Overview, GL Drill, GPU Splits, Close-Slide Handoff, source-constrained Q&A, and the finalizer/export blocker. The complete refresh, QA, sign-off, lock, and ship process comes from the author’s description.
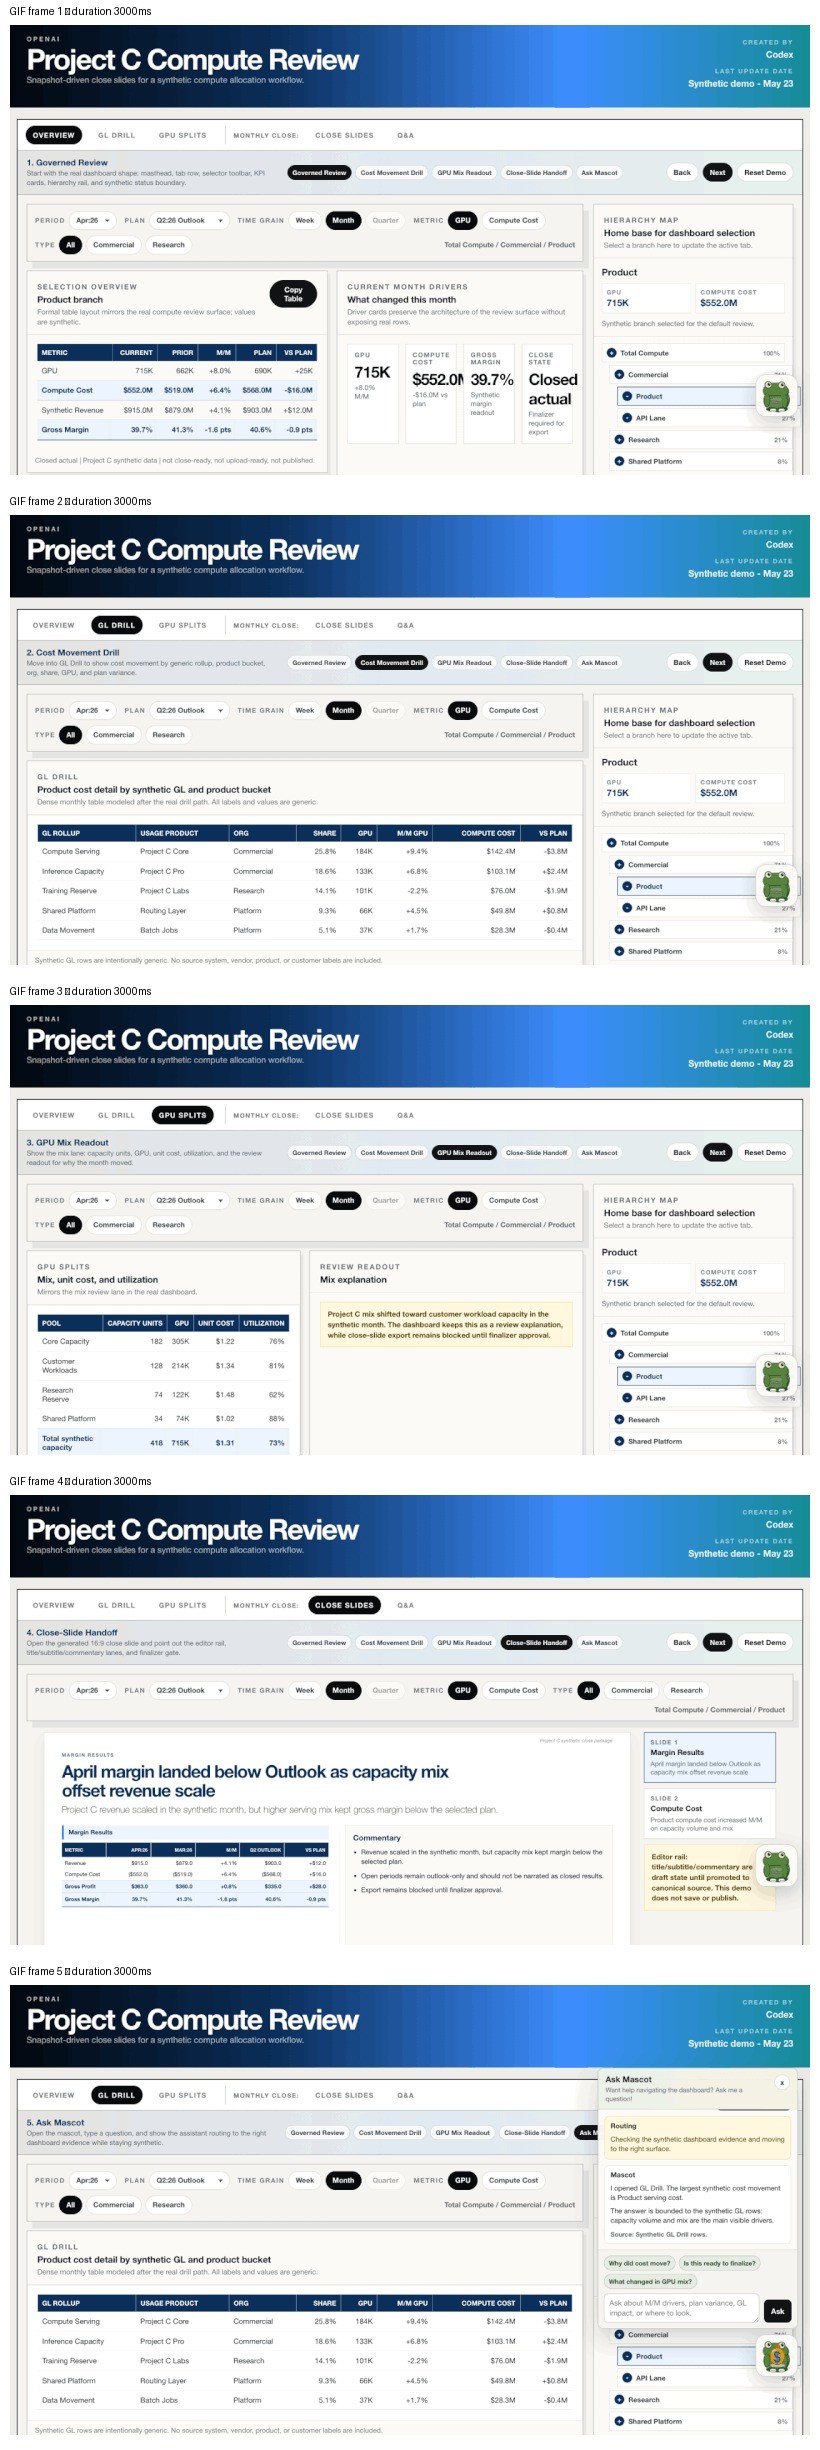
Caption: Day 6 no longer treats the monthly close deck as a single file. It brings the data, narrative, page status, and review actions into one workspace.
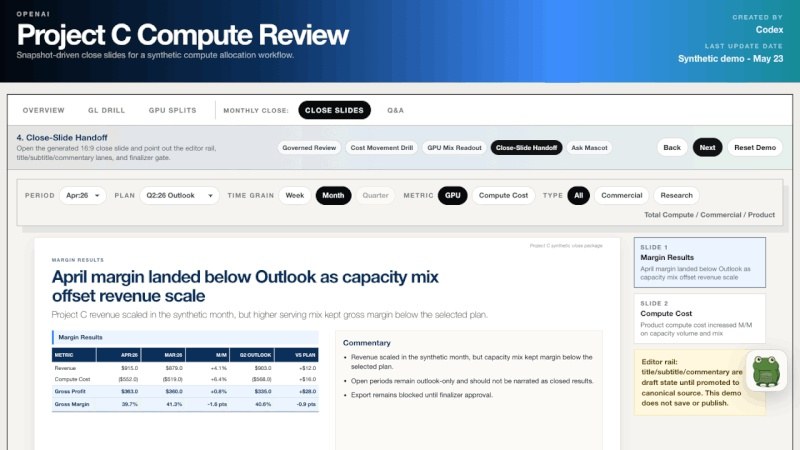
Caption: Close-Slide Handoff places the period status, slide owner, finalizer, and export conditions on the page, making review part of the workflow.
First-Phase Conclusion: AI Begins Turning Finance Work into Executable Units
Days 1–6 appear to cover six different scenarios: marketing allocation, sales signals, headcount, an Opex dashboard, BvA reconciliation, and a monthly close deck. Remove the tool names and interface designs, however, and they are all doing the same thing: breaking finance work that depends on manual handling and individual experience into units that can be described, executed, and reused.
A unit of work usually contains five stages:
Input
→ Processing
→ Exceptions
→ Review
→ Output
For Day 1, the inputs are spend and outcome, processing is the response curve, exceptions are insufficient data or conflicting constraints, review is completed by Marketing Finance and the growth team, and the output is a set of budget allocation options.
For Day 2, the inputs are customer communications and account context, processing is evidence extraction and stage classification, exceptions are low confidence and cross-source conflicts, review is completed by RevOps, Sales, and Finance, and the output is a launch-signal view.
For Day 3, the inputs are the position plan, HCM, ATS, and hierarchy, processing is position reconciliation, exceptions are duplicate or missing mappings, review is completed by Finance, HR, and Recruiting, and the output is a capacity view and leadership summary.
For Day 4, the input is a governed Opex dataset, processing is interface building and refresh, exceptions are failed data or component checks, review is completed by the Finance owner, and the output is an analytical app the business can use.
For Day 5, the inputs are plan, GL, POs, and accruals, processing is mapping, tie-out, and variance analysis, exceptions enter the reconciliation queue, review is completed by Accounting and business Finance, and the output is a BvA workspace and commentary.
For Day 6, the inputs are close data, rules, and the slide template, processing is refresh, QA, and a narrative draft, exceptions appear as readiness gaps, review is completed by the slide owner and finalizer, and the output is an approved close deck.
This decomposition creates three types of change in the work.
First, Finance Moves from “Producing Outputs” to “Designing Units of Work”
In the past, the value of an excellent analyst often showed up as individual fluency: knowing where to find files, which table to copy, which number is prone to error, and how management prefers the narrative to be framed. That knowledge lives in individual actions and is difficult for the team to reuse.
For AI to execute the work, the team must make this tacit knowledge explicit: What are the inputs? What are the rules? What counts as an exception? Who exercises judgment? What must ultimately be delivered? As a result, part of Finance’s work shifts from personally producing every output to designing tasks that can be executed repeatedly.
This is more than a simple efficiency improvement. Only a clearly described unit of work can be reused, handed off, evaluated, and continually improved. Even if the team does not use an AI agent yet, completing this step reduces its dependence on a single “Excel hero” or “deck owner.”
Second, Human Judgment Moves from the End of the Process to Explicit Checkpoints
In a traditional process, human judgment is everywhere but is rarely identified on its own. Analysts correct mappings while copying data, determine the reasons for variances while writing commentary, and then have a manager review the result as a whole. Judgment and mechanical work are intermingled, making automation difficult to separate.
Days 1–6 offer another division of labor: AI first completes frequent, repeatable preparation, while people concentrate on checkpoints that require accountability and business context.
- The model proposes budget allocation options; people approve capital allocation.
- The model classifies customer signals; people resolve conflicts and resource adjustments.
- The model organizes position status; people define organizational policies.
- The model builds the interface; people own the finance metrics.
- The model completes reconciliation and a first draft; people exercise accounting and business judgment.
- The model prepares close materials; people review and approve publication.
AI entering Finance therefore does not eliminate judgment. It forces the team to answer more clearly: Which items are executable rules? Which exceptions require professional judgment? Who is accountable for the final decision?
Third, Finance Deliverables Begin to Shift from Files to Continuously Operating Assets
Excel, PowerPoint, and dashboards will not disappear, but they are no longer the only outputs.
Day 1 leaves behind an allocation model and decision history; Day 2, a taxonomy, labeled examples, and an account-signal model; Day 3, a position-level operating model; Day 4, an analytical-app template; Day 5, a reconciliation workspace; and Day 6, a close workflow.
These assets share one characteristic: they can continue to run in the next cycle. When new data arrives, the team does not need to begin with a blank file. It refreshes the existing model, rules, interface, and review tasks. Human revisions and judgments can also become inputs to the next cycle.
This is the dividing line between “using AI to perform a task once” and “using AI to take on a unit of work.”
Organizational Change: Not Simply Reducing Headcount, but Redefining Interfaces
When work is decomposed into executable units, the interfaces among Finance, business teams, and Data/IT also change.
The Finance analyst’s role shifts from output producer to workflow owner. In the past, analysts completed the work by operating Excel fluently, remembering file locations, and handling exceptions manually. Their new responsibility is to define inputs, metrics, steps, exceptions, and outputs; observe where AI fails; and turn each correction into a reusable rule for the next cycle. Modeling and business judgment remain important, but “Can I design my work as a process the team can run?” becomes a new capability.
Finance managers no longer manage only people and deadlines. They must manage a portfolio of units of work: which ones can run automatically, which are awaiting reviewer approval, which are blocked by data issues, and which outputs have entered business discussion. Workload is no longer measured only by “how many reports did we produce this week?” Managers can also observe run frequency, exception volume, human review time, and the recommendations that were adopted.
Business partners participate earlier. Marketing, Sales, HR, and cost-center leaders do more than read the final result; they provide constraints, taxonomies, and business context in advance. Channel capacity on Day 1, sales stages on Day 2, position status on Day 3, and variance reasons on Day 5 cannot be defined by Finance or AI alone. The earlier business knowledge enters the inputs and rules, the less repeated rework the downstream commentary requires.
Data/IT teams, meanwhile, shift from delivering individual reports to providing a shared foundation. They maintain data interfaces, identity and access, a stable operating environment, and reusable components; Finance owns the definitions, judgments, and use of each unit of work. This model both keeps every request from entering the engineering queue and prevents each Finance user from building an unmaintainable set of connections and calculations.
A small pilot usually does not require a new AI department. A more practical group consists of one Finance owner who knows the process, one business partner who can supply business judgment, and one Data/IT colleague who helps establish the data interface or operating environment. The three work together around one weekly or monthly unit of work, let it run for several consecutive cycles, and only then decide whether to expand it.
Organizational change does not mean immediately eliminating roles. The more common early outcome is that the team moves time from data movement, formatting, and version tracking into exception handling, business discussion, and process design. Only after multiple stable cycles can managers see which capacity has actually been released and whether it should be redirected to forecasting, decision support, or deeper business partnership.
This Is Only the First Phase
Days 1–6 show that AI can already enter multiple units of work before finance judgment. It reads operating signals, organizes cross-system data, generates options and interfaces, completes reconciliations, prepares close materials, and organizes the issues that need human attention.
These six days do not attempt to present an end-state operating model. The interim change they identify is more specific:
AI is breaking finance work that once depended on Excel, email, manual data movement, and individual experience into executable stages for input, processing, exceptions, review, and output.
Once an individual workflow can run continuously, a new question appears.
Marketing allocation uses its own data and model, sales signals read customer communications, the HC view connects HCM and ATS, and the Opex app, BvA workspace, and close deck each refresh separately. If these tools remain independent, Finance has merely exchanged six sets of manual files for six AI tools. Data, definitions, and knowledge will continue to drift.
The next question, then, is not how to build six more tools. It is:
Once individual finance workflows can be executed by AI, how do P&L, Sheets, dashboards, forecasts, management reporting, and the knowledge base remain synchronized?
That is the question Days 7–12 will answer.
Primary Original Sources
- Day 1 | Stacie Faggioli: https://www.linkedin.com/posts/stacie-faggioli-0820912_12daysofchatcodexstratfin-activity-7472321087754657792-I7zA
- Day 2 | Jake Stamell: https://www.linkedin.com/posts/jake-stamell_12daysofchatcodexstratfin-activity-7472677884411686912-r86v
- Day 3 | Kathir Sundarraj: https://www.linkedin.com/posts/katzsunn_12daysofchatcodexstratfin-activity-7473023143020769280-92zN
- Day 4 | Scott Dean: https://www.linkedin.com/posts/scott-dean-b8071a24_12daysofchatcodexstratfin-12daysofcodex4stratfin-activity-7473389078101524481-FUeg
- Day 5 | Amir Tavoli: https://www.linkedin.com/posts/amir-tavoli-840355177_12daysofchatcodexstratfin-activity-7473776537398546432-FQkW
- Day 6 | Kyle K.: https://www.linkedin.com/posts/kkober_12daysofchatcodexstratfin-activity-7474228889142050818-rmao
- Official OpenAI Finance presentation (supplementing Days 1–2): https://www.youtube.com/watch?v=1NtS2KdnDok
- General documentation for OpenAI Codex Sites: https://developers.openai.com/codex/sites
- OpenAI’s official note on the confidential S-1 submission: https://openai.com/index/openai-submits-confidential-s-1/